Dashboards and reporting that show what needs attention.
VOS helps businesses turn operational data into useful dashboards and reports that show active work, delayed items, completed work, open issues, follow-up needs, and management review visibility.
Dashboards should help owners make decisions faster.
A useful dashboard does not show everything. It shows the right information at the right level so owners and managers can understand status, risk, workload, and next actions.
Common problems
- Status reports are manually built or outdated
- Owners cannot quickly see what is active or delayed
- Important work is buried in spreadsheets or email
- Reports show data but do not support action
Reporting designed around decisions.
Operational dashboards
Create views for active work, delayed work, blocked items, open issues, and completed work.
Management reporting
Build reports that help owners see workload, priorities, bottlenecks, and trends.
Action-focused metrics
Organize data around what needs attention, not just what has been recorded.
See how a management dashboard can look.
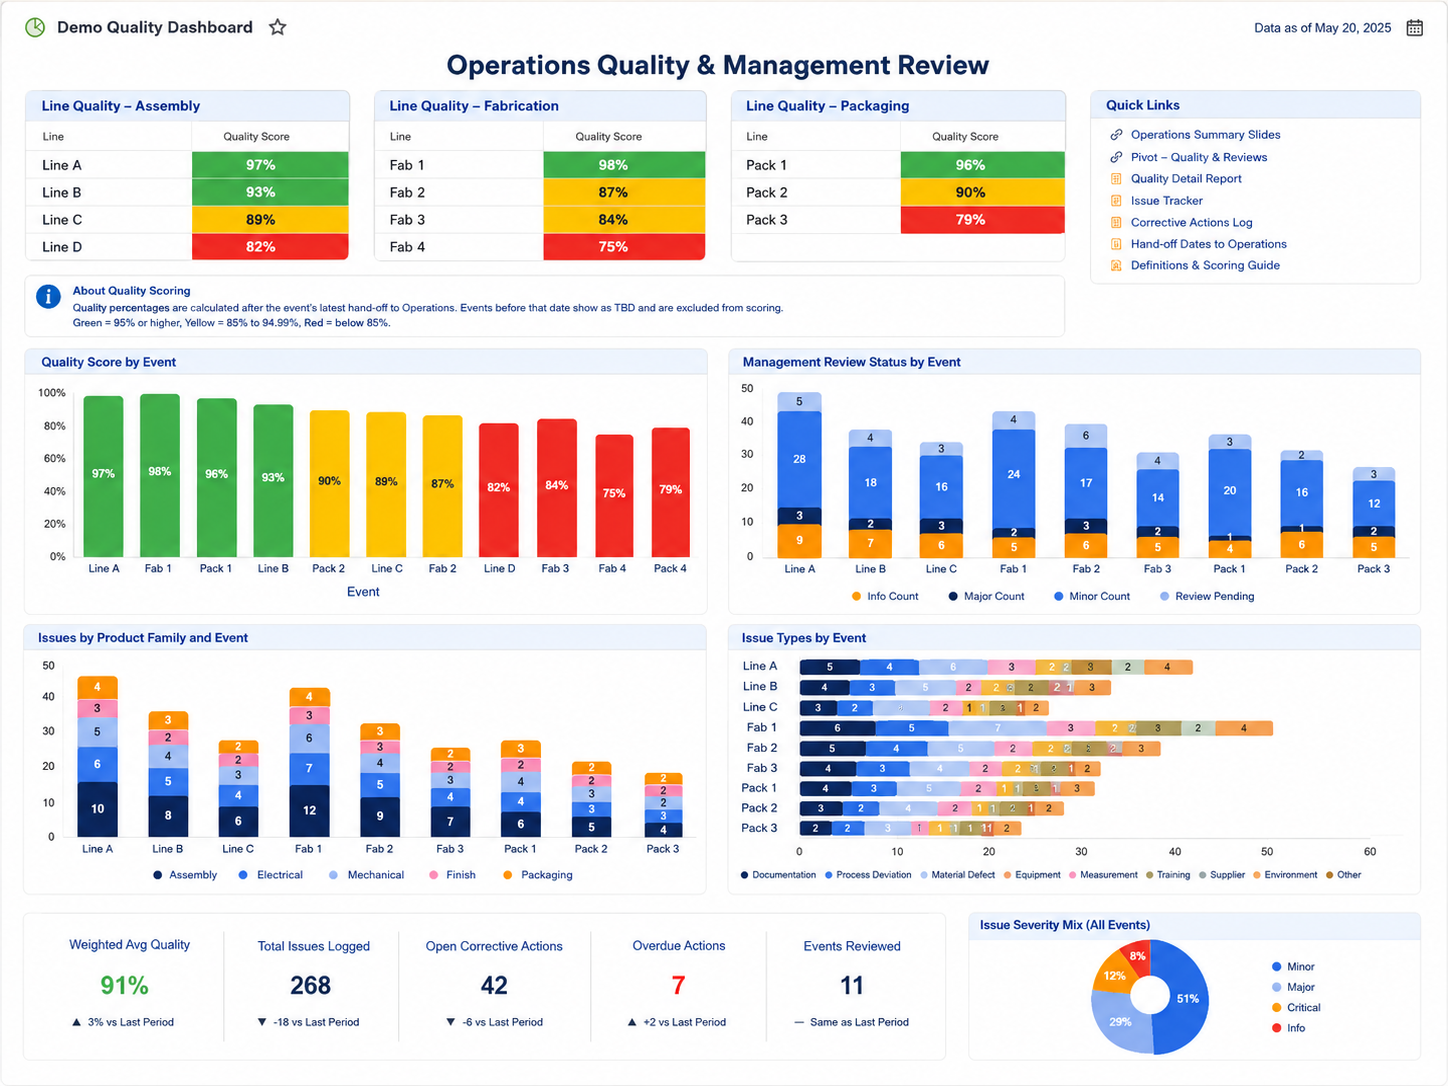
What this example shows
This example uses sample data to show the kind of dashboard structure VOS can build: a fast summary at the top, linked resources, trend charts, issue breakdowns, and action-oriented metrics.
- Quality tables for quick status checks
- Review counts, issue totals, and open action tracking
- Category breakdowns to find patterns and bottlenecks
- Executive-level visibility without needing multiple reports
Start with a Workflow Review.
A Workflow Review can identify the key information your dashboard should show first.
Request a Workflow Review